When you use Notion to take notes, you can use an existing database or table to create a Gantt Chart. This is a separate version of Notion for viewing existing databases and synchronizing between the devices you are using.
You can create them from scratch or replace the regular view you already have. You can track data on any device while at home or on the go. In addition, you can comment on each card, assign online tasks to each person, add attached files or annotations.
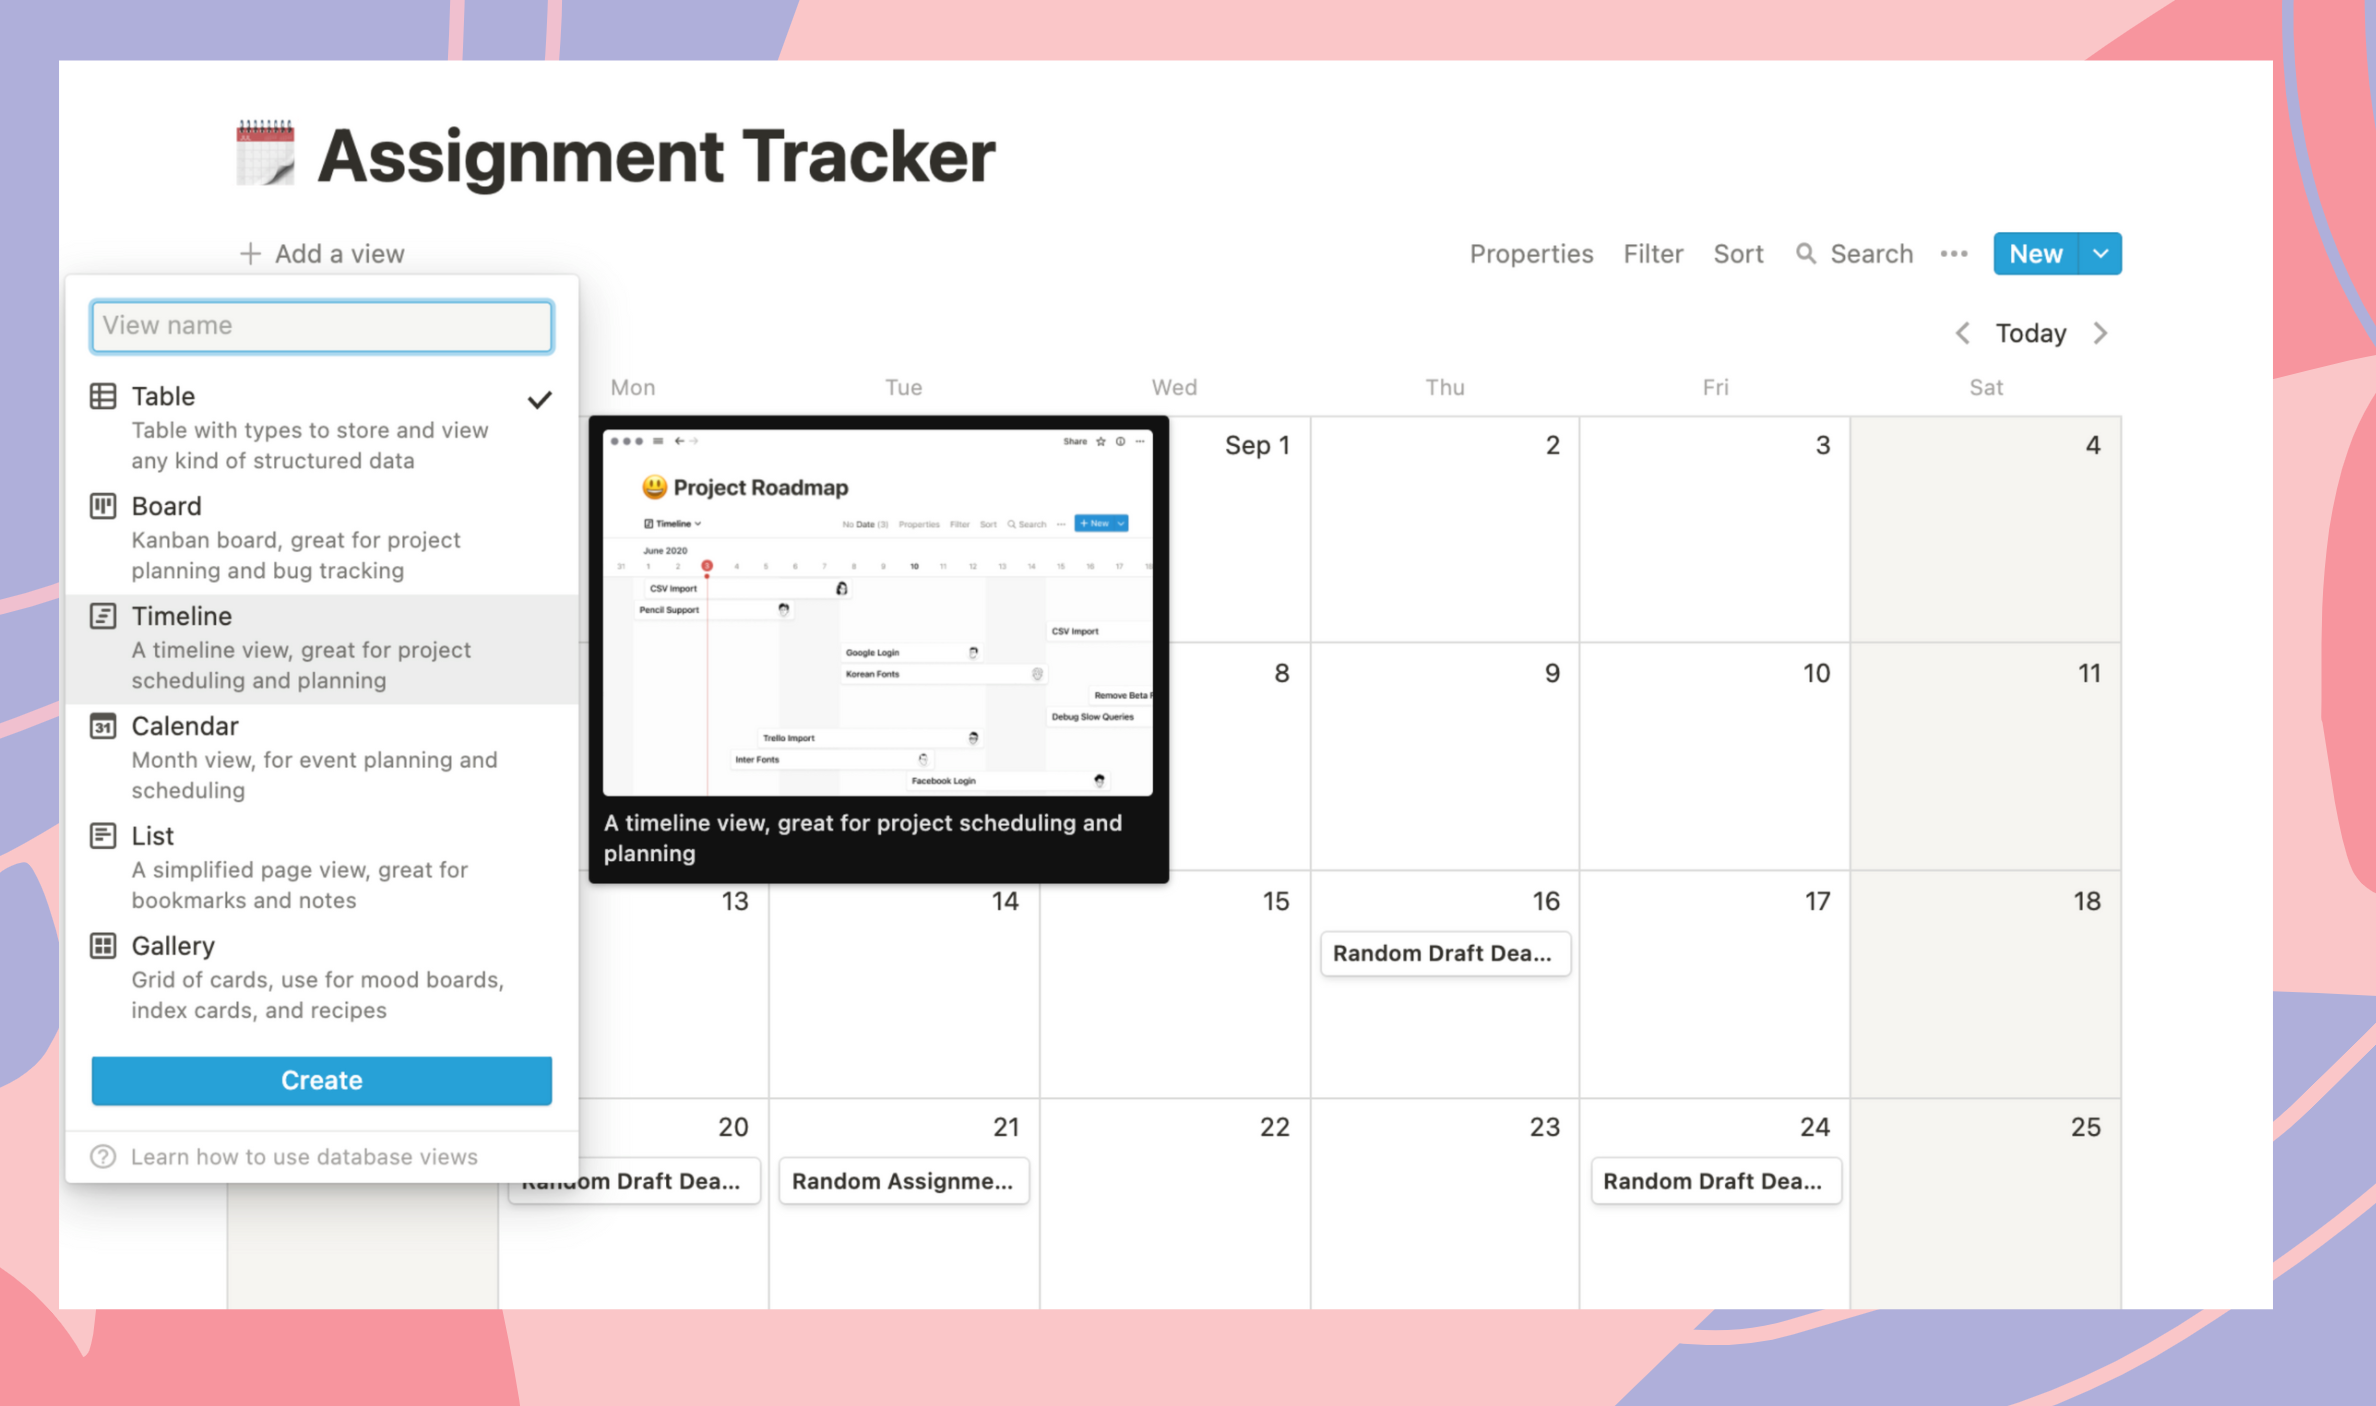
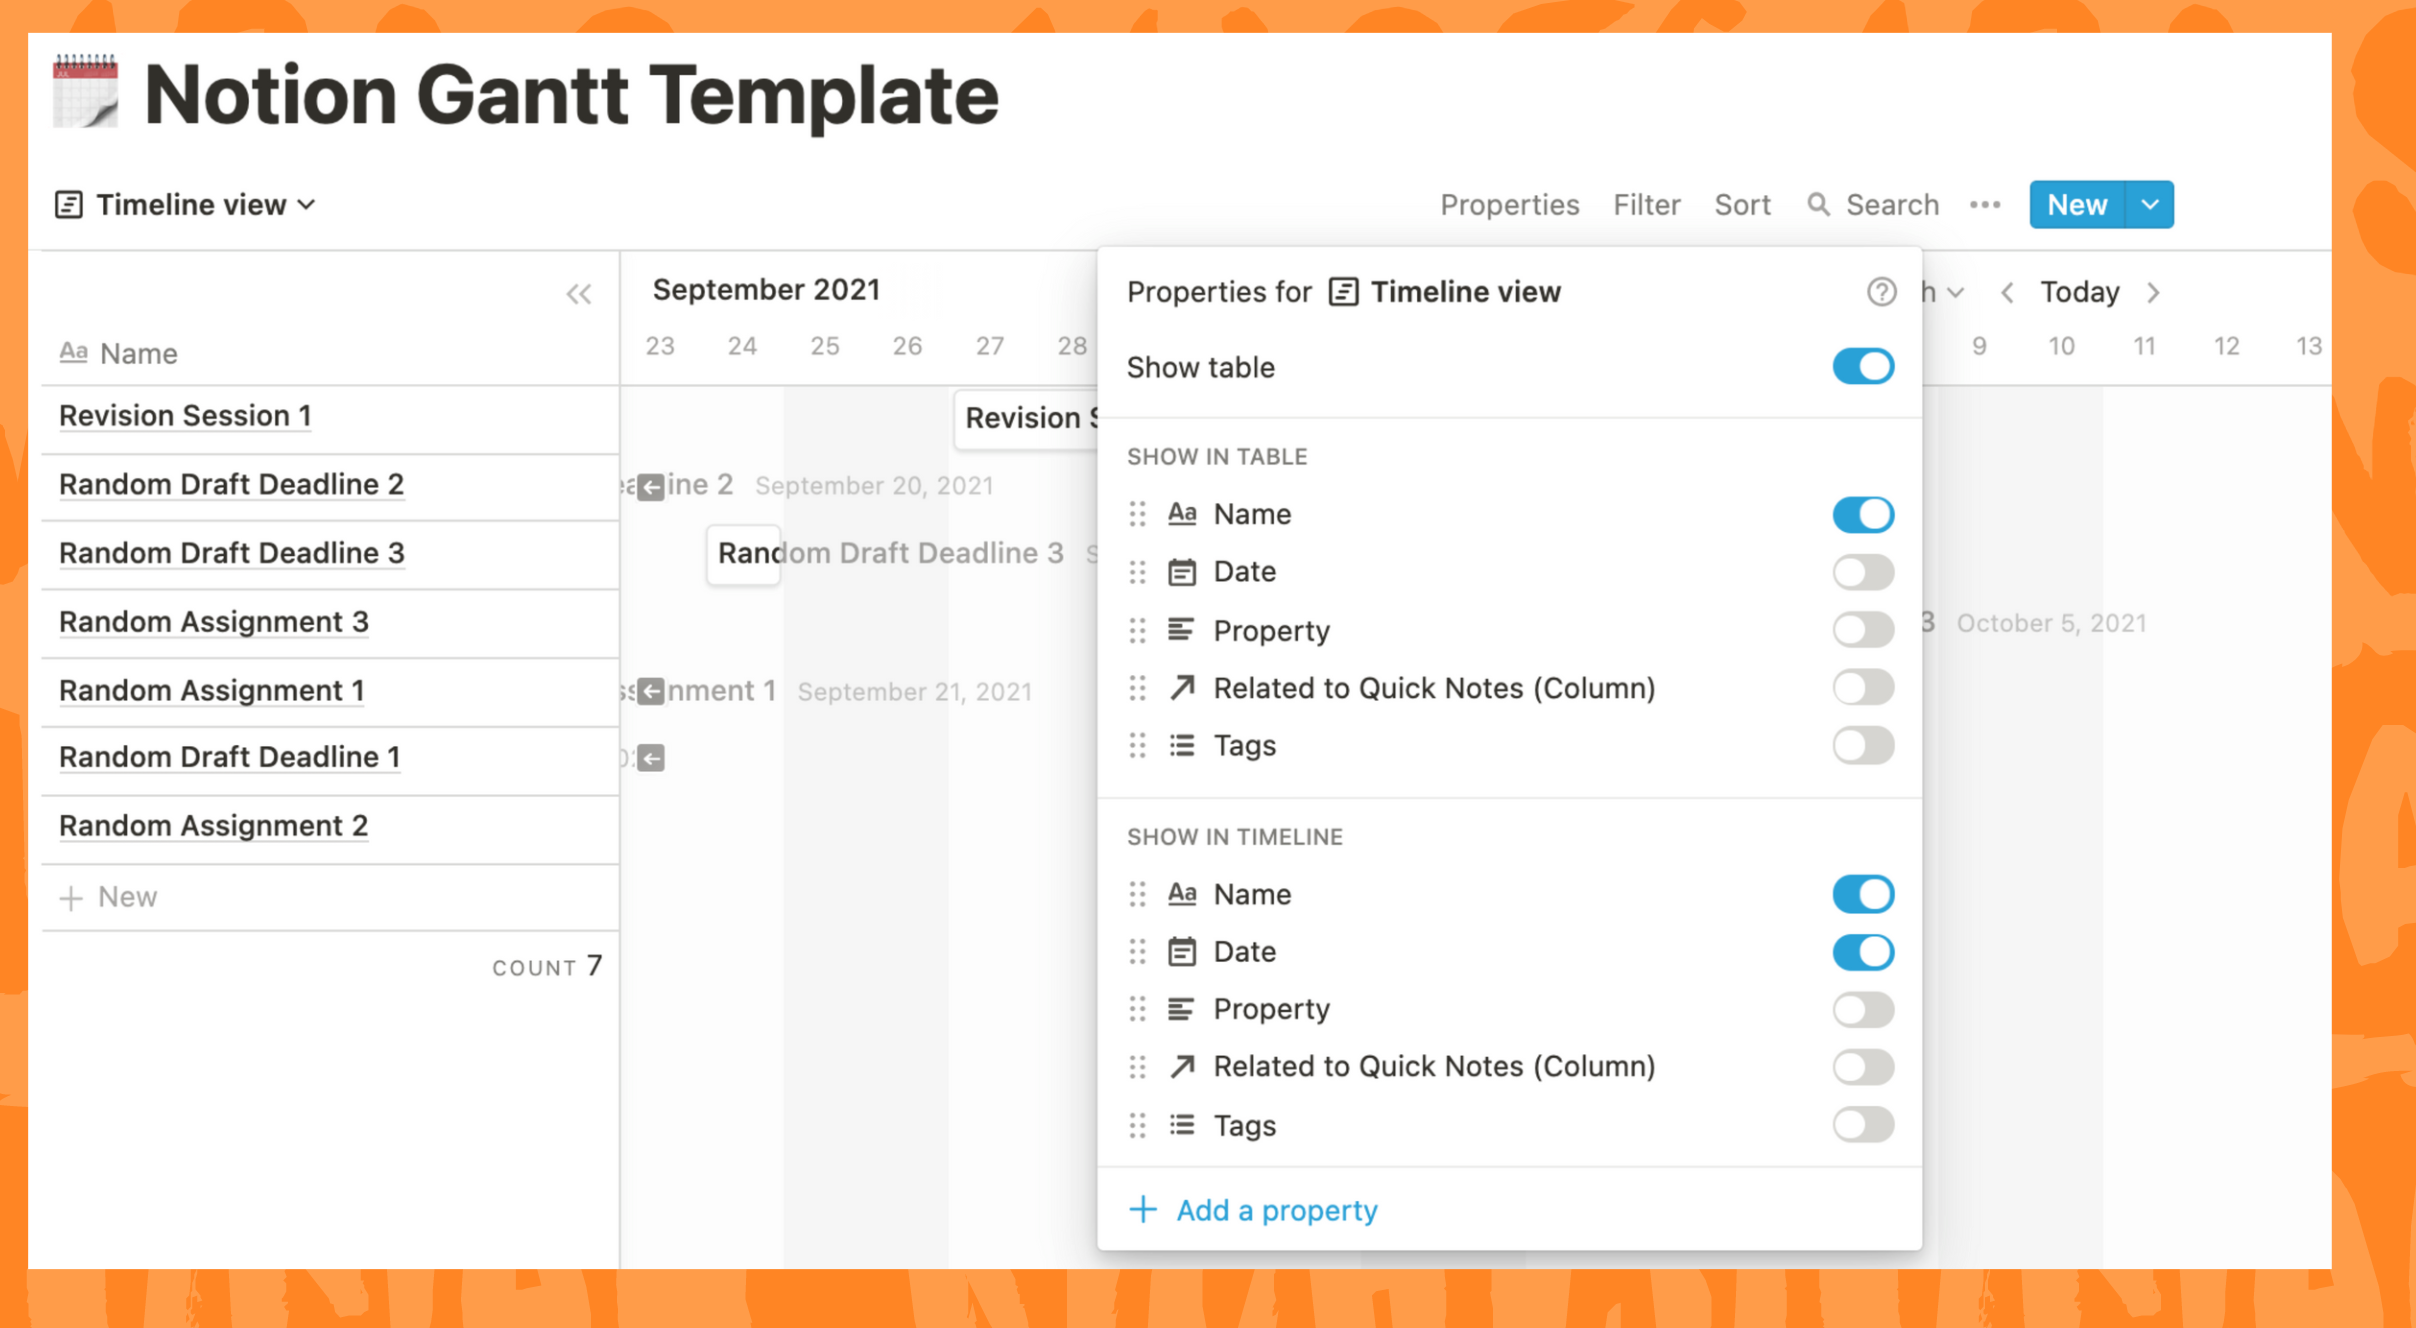
To create a Gantt Chart, click Add a View right next to the title and click Timeline. When moving the mouse to the Timeline selection line, a table in the subview will appear for your reference.

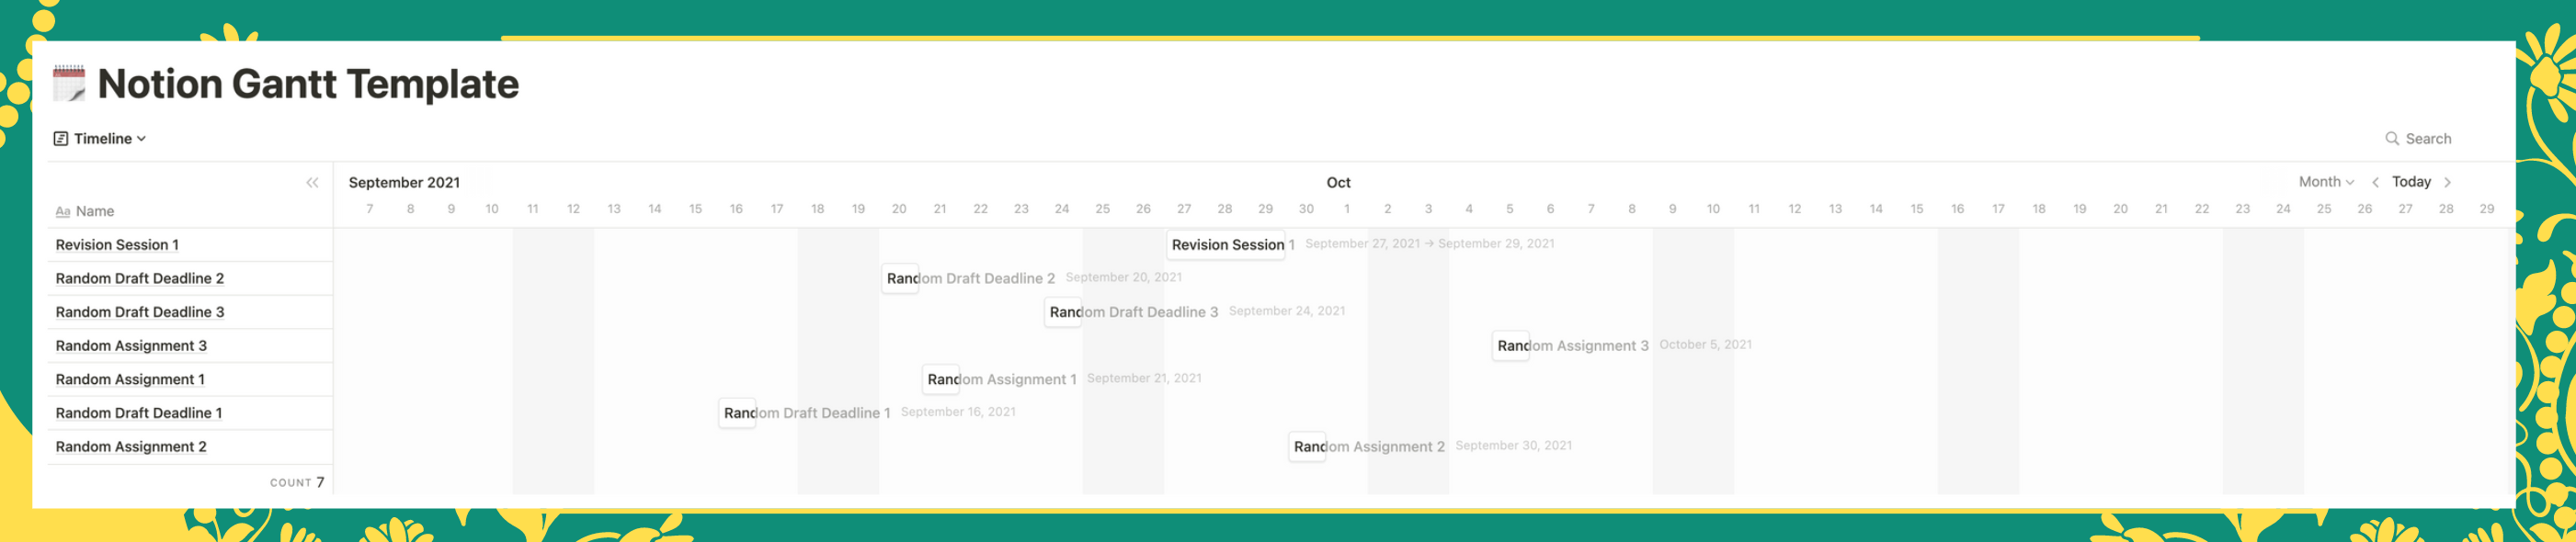
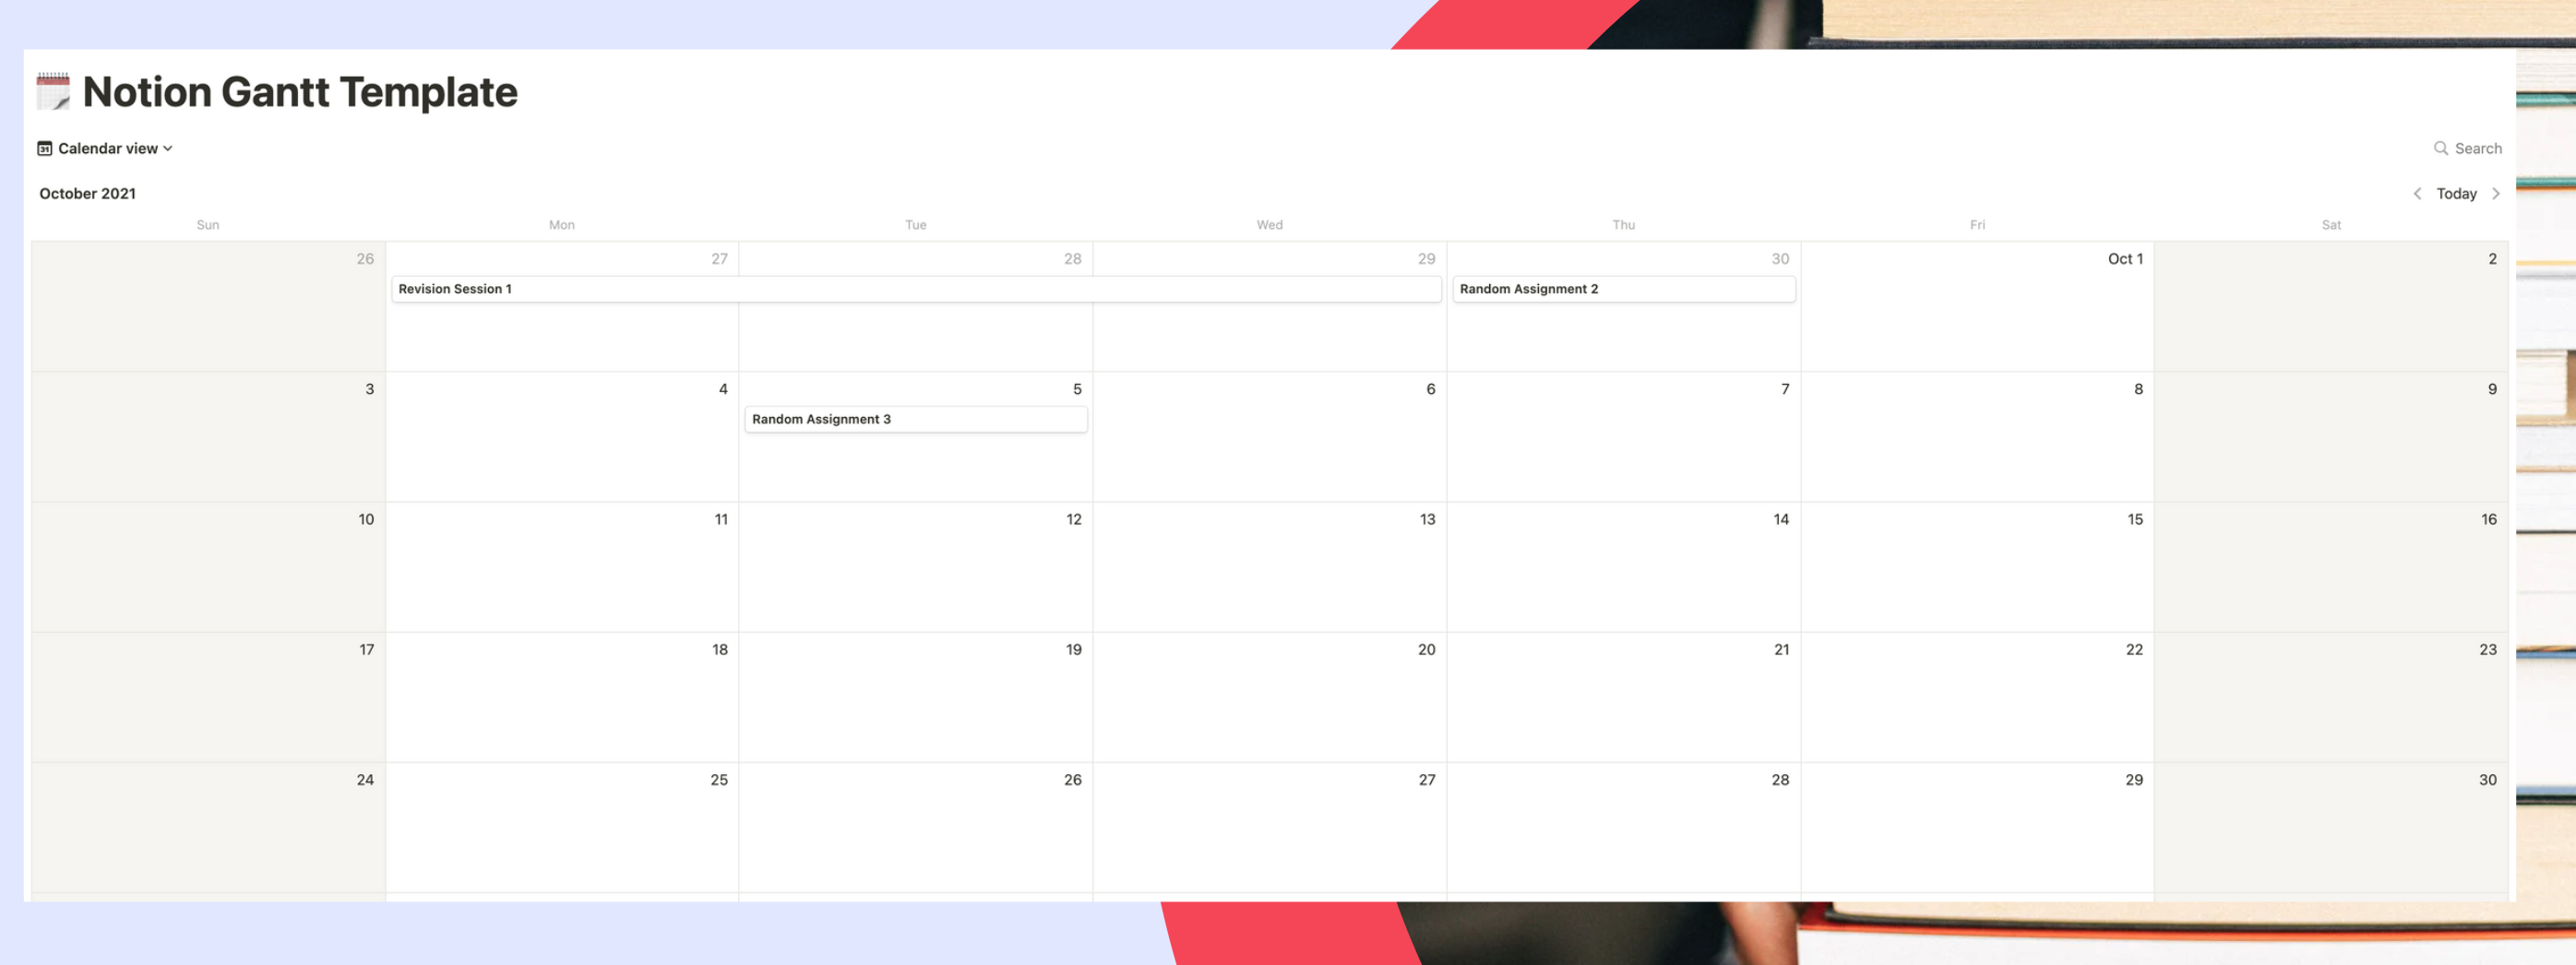
Once selected, Notion will default to showing databases or tables as an option from the calendar, standard Gantt Chart view.

When you want to add or remove data, click Properties and perform the action you need.

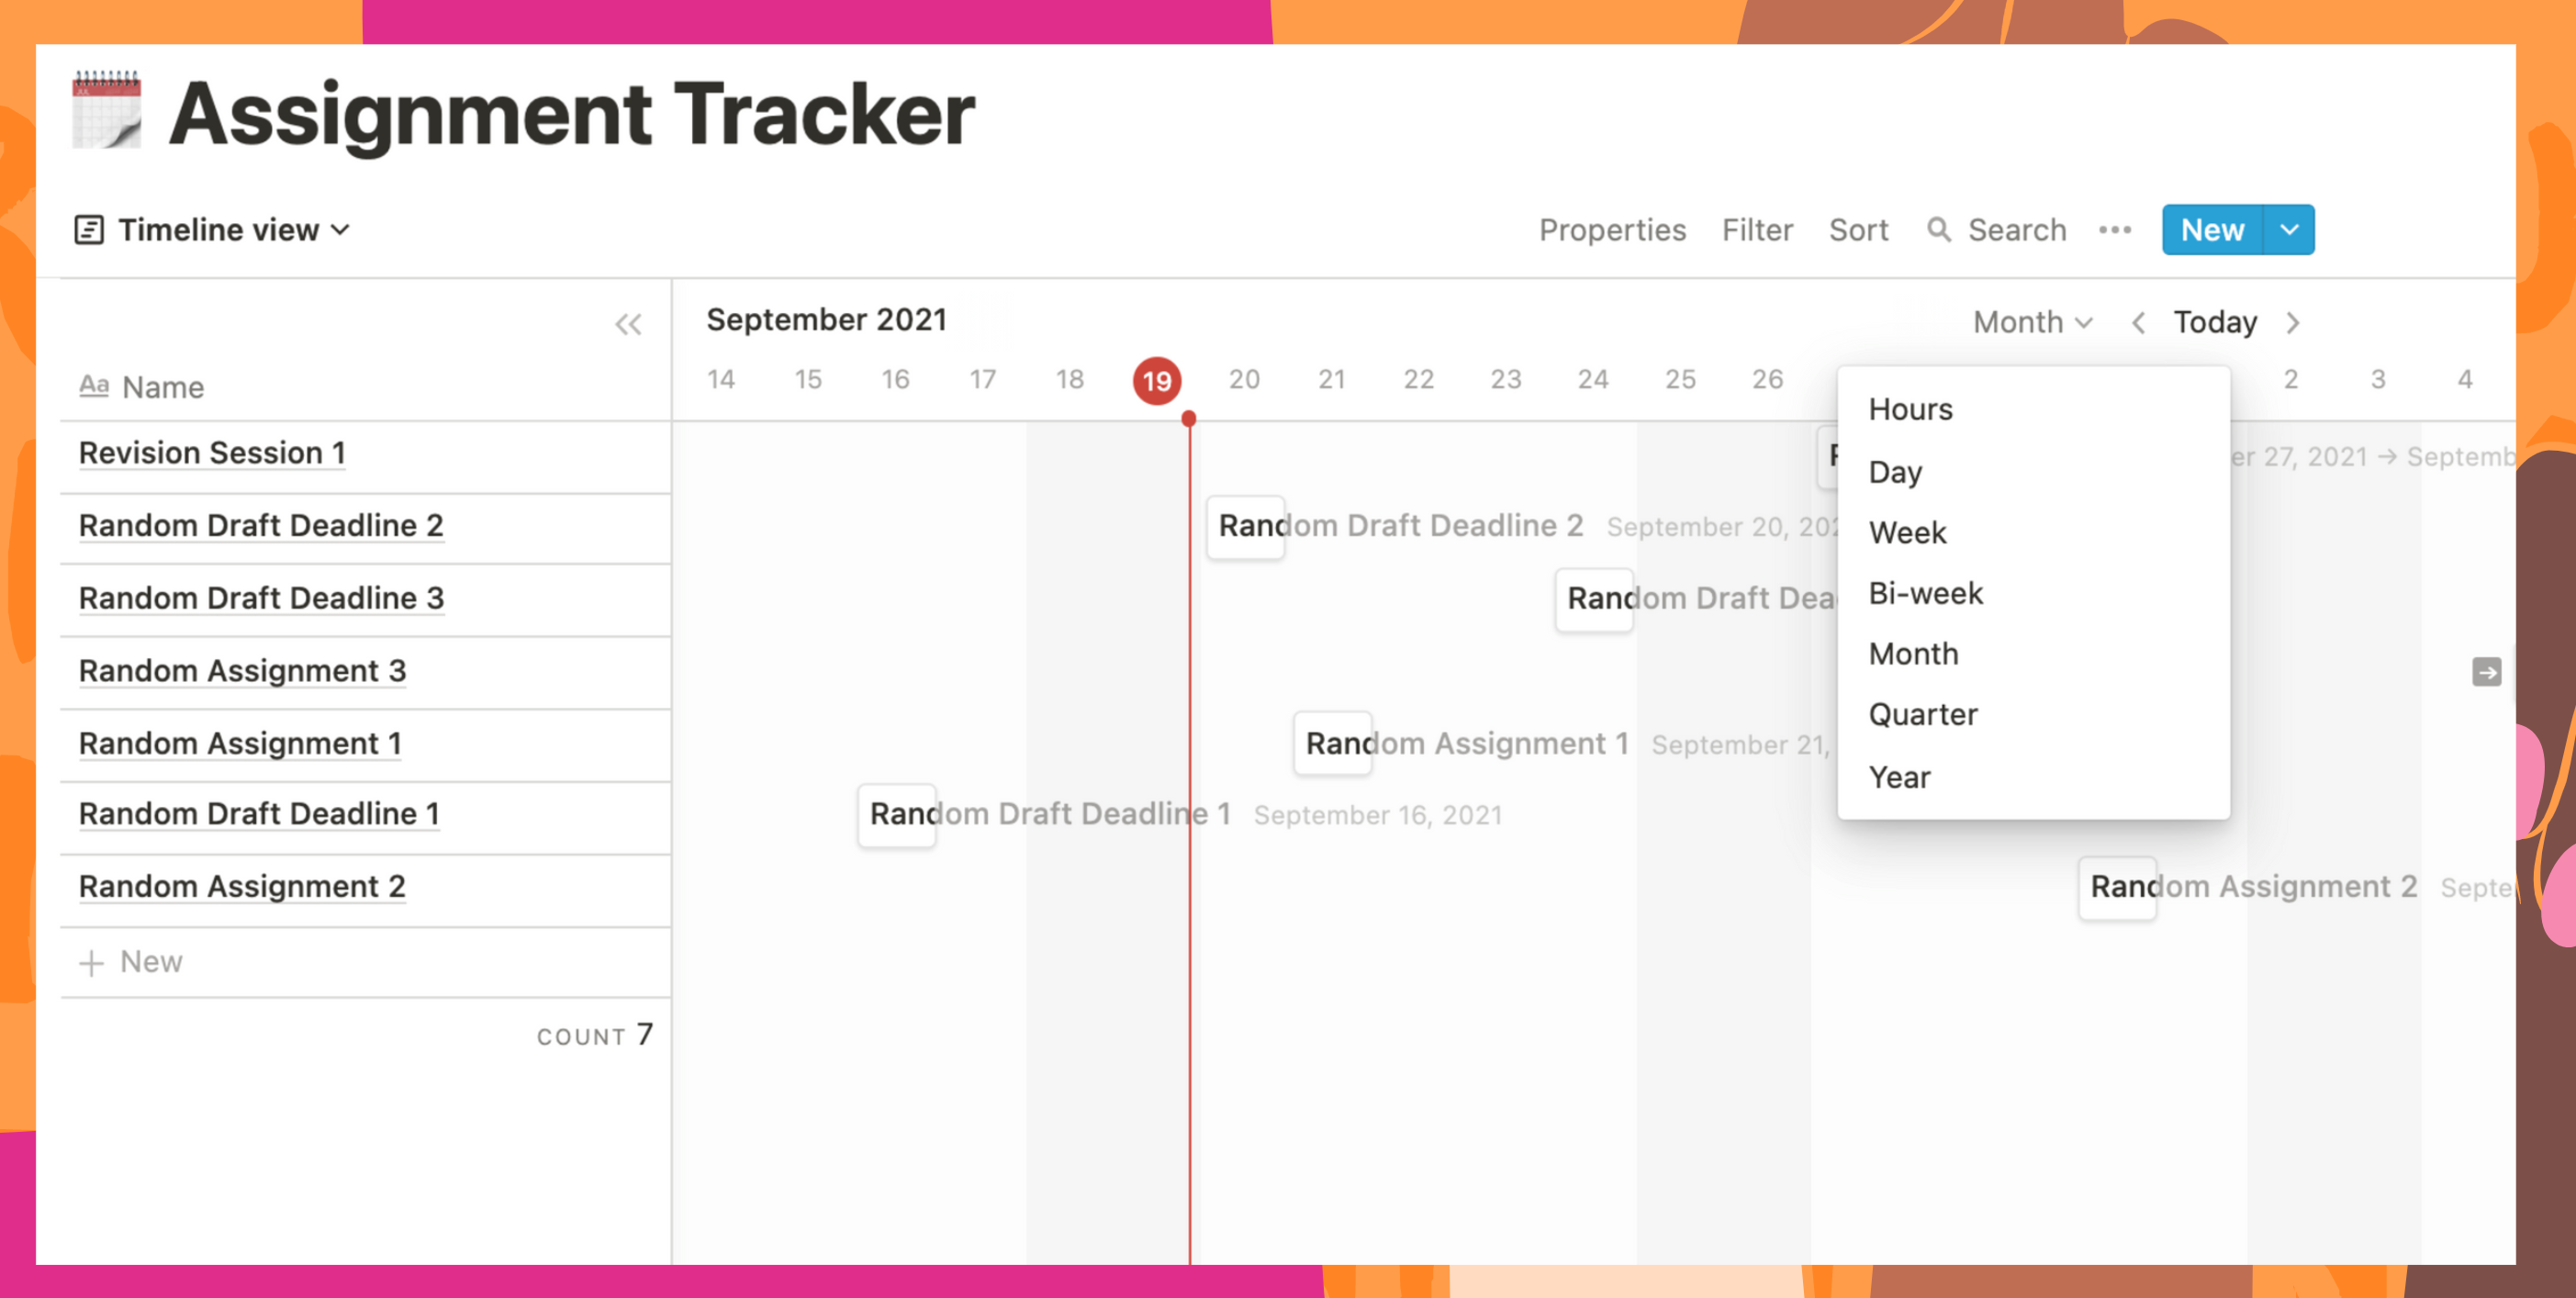
For ease of tracking, you can change the way the data is displayed according to the time frame you want. When selected, Notions will display by Month, but if you need to, you can convert them to Hour, Day, Week, Quarter, or even Year. This will make it easier for you to capture the schedule and keep track of the required activity. You click the Month option and choose a suitable alternative view.

Try creating your own Gantt Chart. Try them out and tweak them until it’s exactly what you expect. When you select data and present it according to your ideas, it helps to make your workflow more systematic and smooth.
